What is Phylogenetics?
Phylogenetics is the study of relatedness between species based on ancestral origins. [1] Through studies of these relationships between species, classification of organisms can be made more accurately and the evolutionary origins of particular genes may be determined.
Phylogenetic relationships of different species are often depicted through diagrams known as Phylogenetic Trees (Figure 1). The tips of the branches of a phylogenetic tree represent different species and the branch points represent the common ancestor of the different species. [2] |

Figure [1]. A diagram representing the different components of a phylogenetic tree.
|
Sequence Compilation and Alignment
Before constructing a phylogenetic tree, the necessary information required to do so must be acquired. For the phylogenetic analysis of FOXE1, amino acid sequence data was retrieved from Ensembl via FASTA formatted files. The homologous amino acid sequences of FOXE1 from different species were then aligned using MEGA. Below is the FASTA file for all FOXE1 homologs.
Determining Phylogenetic Relationships
As speciation events occur over a long period of time, precise determination of the phylogenetic relationships can pose as a challenge when constructing phylogenetic trees. To combat this challenge, a variety of statistical models are utilized when constructing phylogenetic trees. For the construction of the FOXE1 phylogenetic trees, statistical models from MEGA were utilized.
Maximum Likelihood Model (MLM)The maximum likelihood model utilizes a probabilistic model of evolution. This statistical model takes into account the sequence differences between different species and generates a phylogenetic tree based on the most plausible representation of the given data. Advantages: The branch lengths provide important information regarding the number of substitutions per site. Disadvantages: Maximum likelihood calculations are sophisticated and are computationally demanding. [3] |
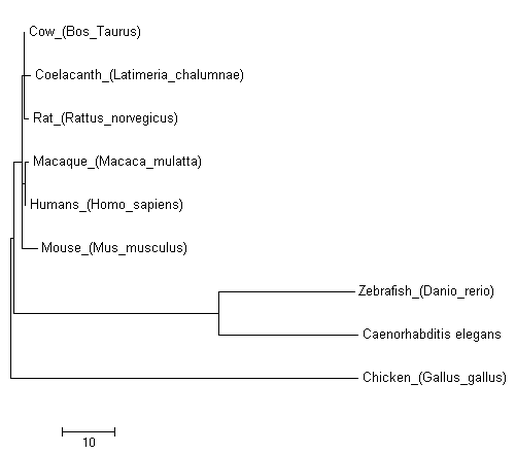
Figure [2]. Phylogenetic tree of FOXE1 homologs of model organisms created using the Jones-Taylor-Thornton (JTT) model of Maximum Likelihood. Branch length is measured in the number of substitutions per site
|
Maximum Parsimony Model (MPM)The maximum parsimony model utilizes algorithms to create phylogenetic trees that require the least number of evolutionary changes. The branch length of this model represents the number of evolutionary changes that have occurred. [3] Advantages: The most simplistic method of analyzing evolutionary changes. Disadvantages: Lack of explicit assumptions and difficulty incorporating knowledge regarding the process of sequence evolution. [4] |
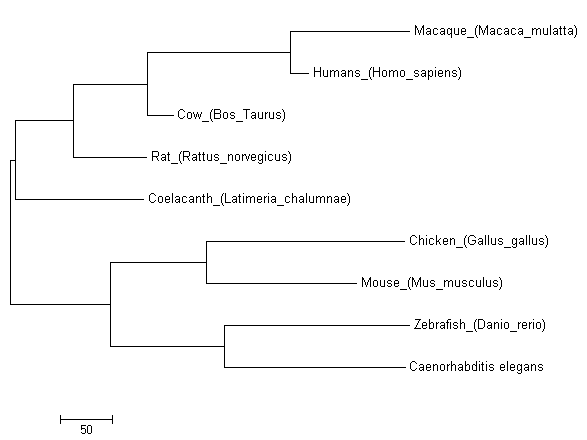
Figure [3]. Phylogenetic tree of FOXE1 homologs of model organisms created using the Subtree-Pruning-Regrafting (SPR) algorithm of Maximum Parsimony.
|
Neighbor-Joining Model (NJM)The neighbor-joining model is an example of a broader method known as the distance-matrix method. This method utilizes a cluster algorithm to measure genetic distances and produce phylogenetic trees with the shortest branch length. [3][4] The branch length of this model represents the evolutionary distances between organisms. Advantages: Computationally efficient and effective for sequences with low levels of divergence. Disadvantages: Performs poorly with divergent sequences and gaps within the sequence alignment. [4] |
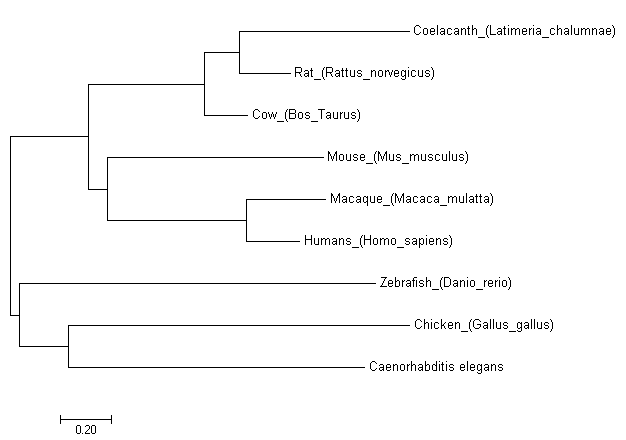
Figure [4]. Phylogenetic tree of FOXE1 homologs of model organisms created using the Neighbor-Joining model.
|
Discussion
While all three models produced similar phylogenetic trees, the MPM stands out in its distant placement of Mus musculus from Homo sapiens. As mice are more closely related to humans than chicken, this is a clear example of the MPM's limitations that are caused by its inability to incorporate sequence evolution knowledge. The MLM and NJM produced nearly identical trees and their similarity can be attributed to MLM's sophisticated calculations as well as NJM's effectiveness for sequences with low levels of divergence. The main difference of the two is that NJM groups Gallus gallus with Caenorhabditis elegans instead of Danio rerio. This can be explained by the divergent sequence of Caenorhabditis in comparison to the other species of the phylogenetic tree. The results of these statistical models show that while NJM may be a good model as FOXE1 is well conserved among species, the MLM should be utilized when incorporating species with more divergent sequences.
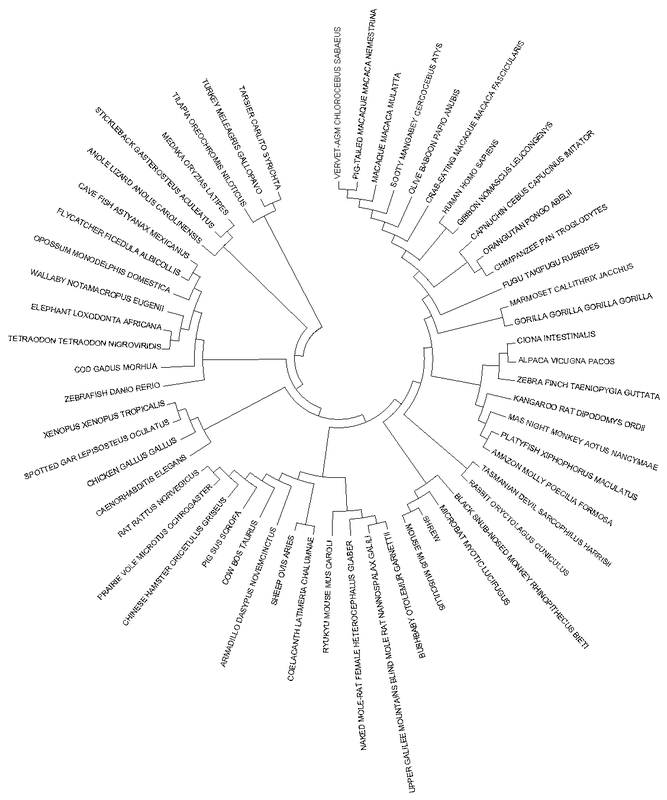
Figure [5]. Phylogenetic tree of all FOXE1 homologs created using the Jones-Taylor-Thornton (JTT) model of Maximum Likelihood.
References
[1] Haque, Omar Sultan. “Phylogenetics.” Encyclopædia Britannica, Encyclopædia Britannica, Inc., 4 Aug. 2016, https://www.britannica.com/science/phylogenetics
[2] “Reading Trees: A Quick Review.” Relevance of Evolution: Medicine, https://evolution.berkeley.edu/evolibrary/article/phylogenetics_02
[3] Dowell, K. "Molecular Phylogenetics", (2008) Retrieved fromhttp://www.math.umaine.edu/~khalil/courses/MAT500/papers/MAT500_Paper_Phylogenetics.pdf
[4] Yang Z, Rannala B. Molecular Phylogenetics: Principles and Practice. Nat Rev Genet. 2012 Mar 28;13(5):303-14. Doi: 10.1038/nrg3186
Image References
[1] https://leilabattison.files.wordpress.com/2012/02/dn14392-1_1891.jpg
[1] https://leilabattison.files.wordpress.com/2012/02/dn14392-1_1891.jpg
